
[ad_1]
Over the past month we’ve seen new laptop hardware launches that directly impact the segment of high-performance and portable gaming machines. Intel’s new Core i7-10875H is the key new CPU in their 10th-gen lineup for laptops. At the same time, Nvidia released a boosted RTX Super series GPUs, and the week prior, AMD unleashed a competitive processor that targets the same segment with Ryzen 4000.
Today our focus will be on the RTX 2070 Super Max-Q, but proper context was very important because you should expect to see new laptop models sporting a variety of all this hardware in the coming weeks and months.
It’s taken Nvidia nearly a year to bring their RTX Super GPUs from the desktop to mobile form factors, however as we explained at the time of the announcement, the change is not limited to a frequency bump but there are some neat new features reserved for these new GPUs. In case you missed it, check out our full feature breakdown here.
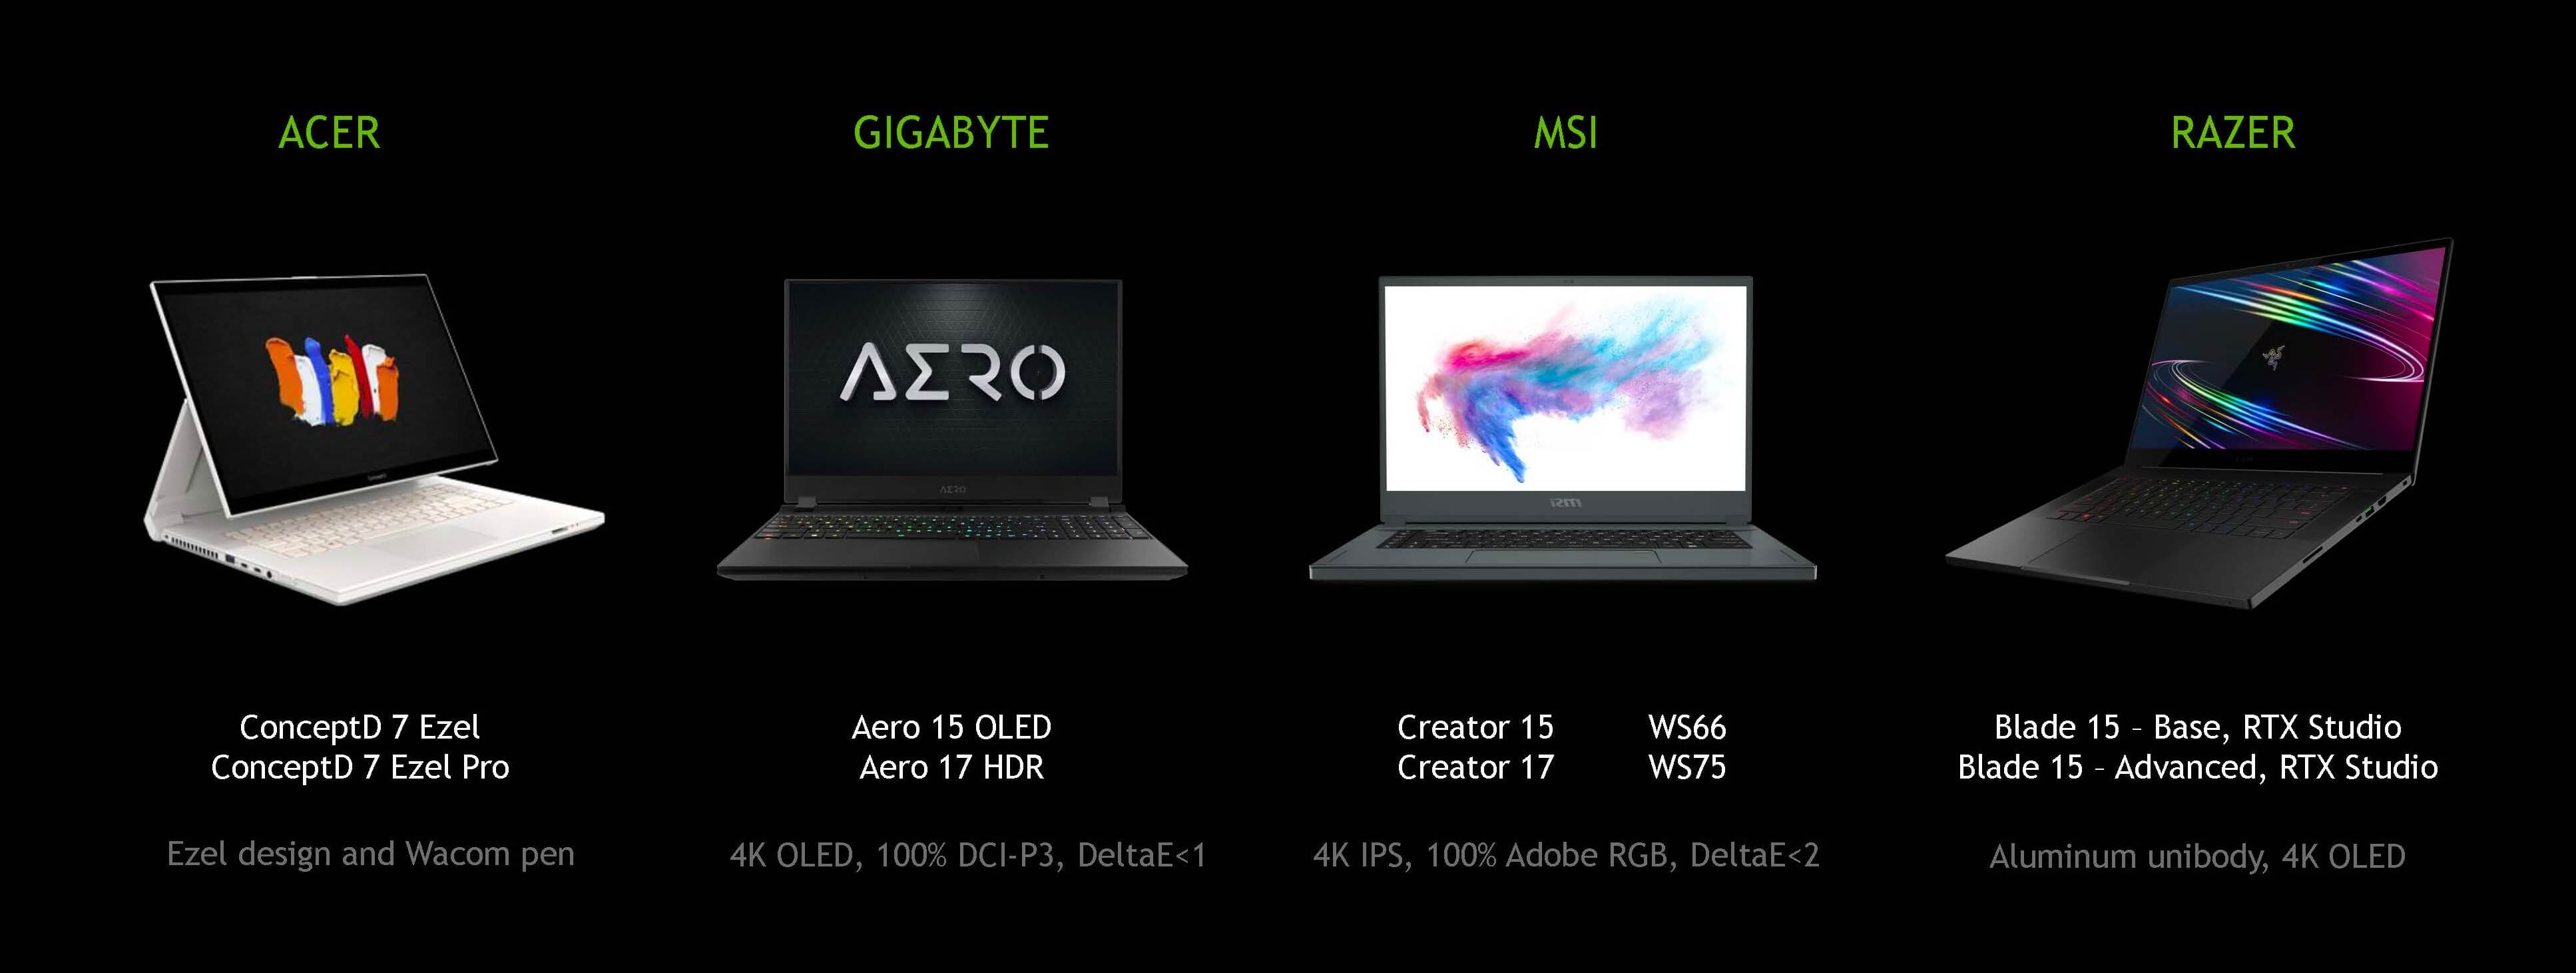
The new laptop GPUs include the RTX 2080 Super, RTX 2070 Super and the GTX 1650 Ti. The RTX 2070 Super is available in a range of TGPs, where the 80W and 90W variants get a Max-Q designation, while the maximum 115W version is referred to as Max-P.
As you can imagine, having all of these different variants and power limits under a single GPU name can be confusing, and is something we continue to be frustrated with. Just take a look at all the GPUs that are called “RTX 2070” these days: two desktop GPUs, two Max-P laptop variants, and at least 4 Max-Q models. Some are Super, some are not Super. Some are Max-Q, others are not. The power targets often aren’t advertised, but whether you end up with an 80W or 90W Max-Q version does have performance implications. But let’s move on…
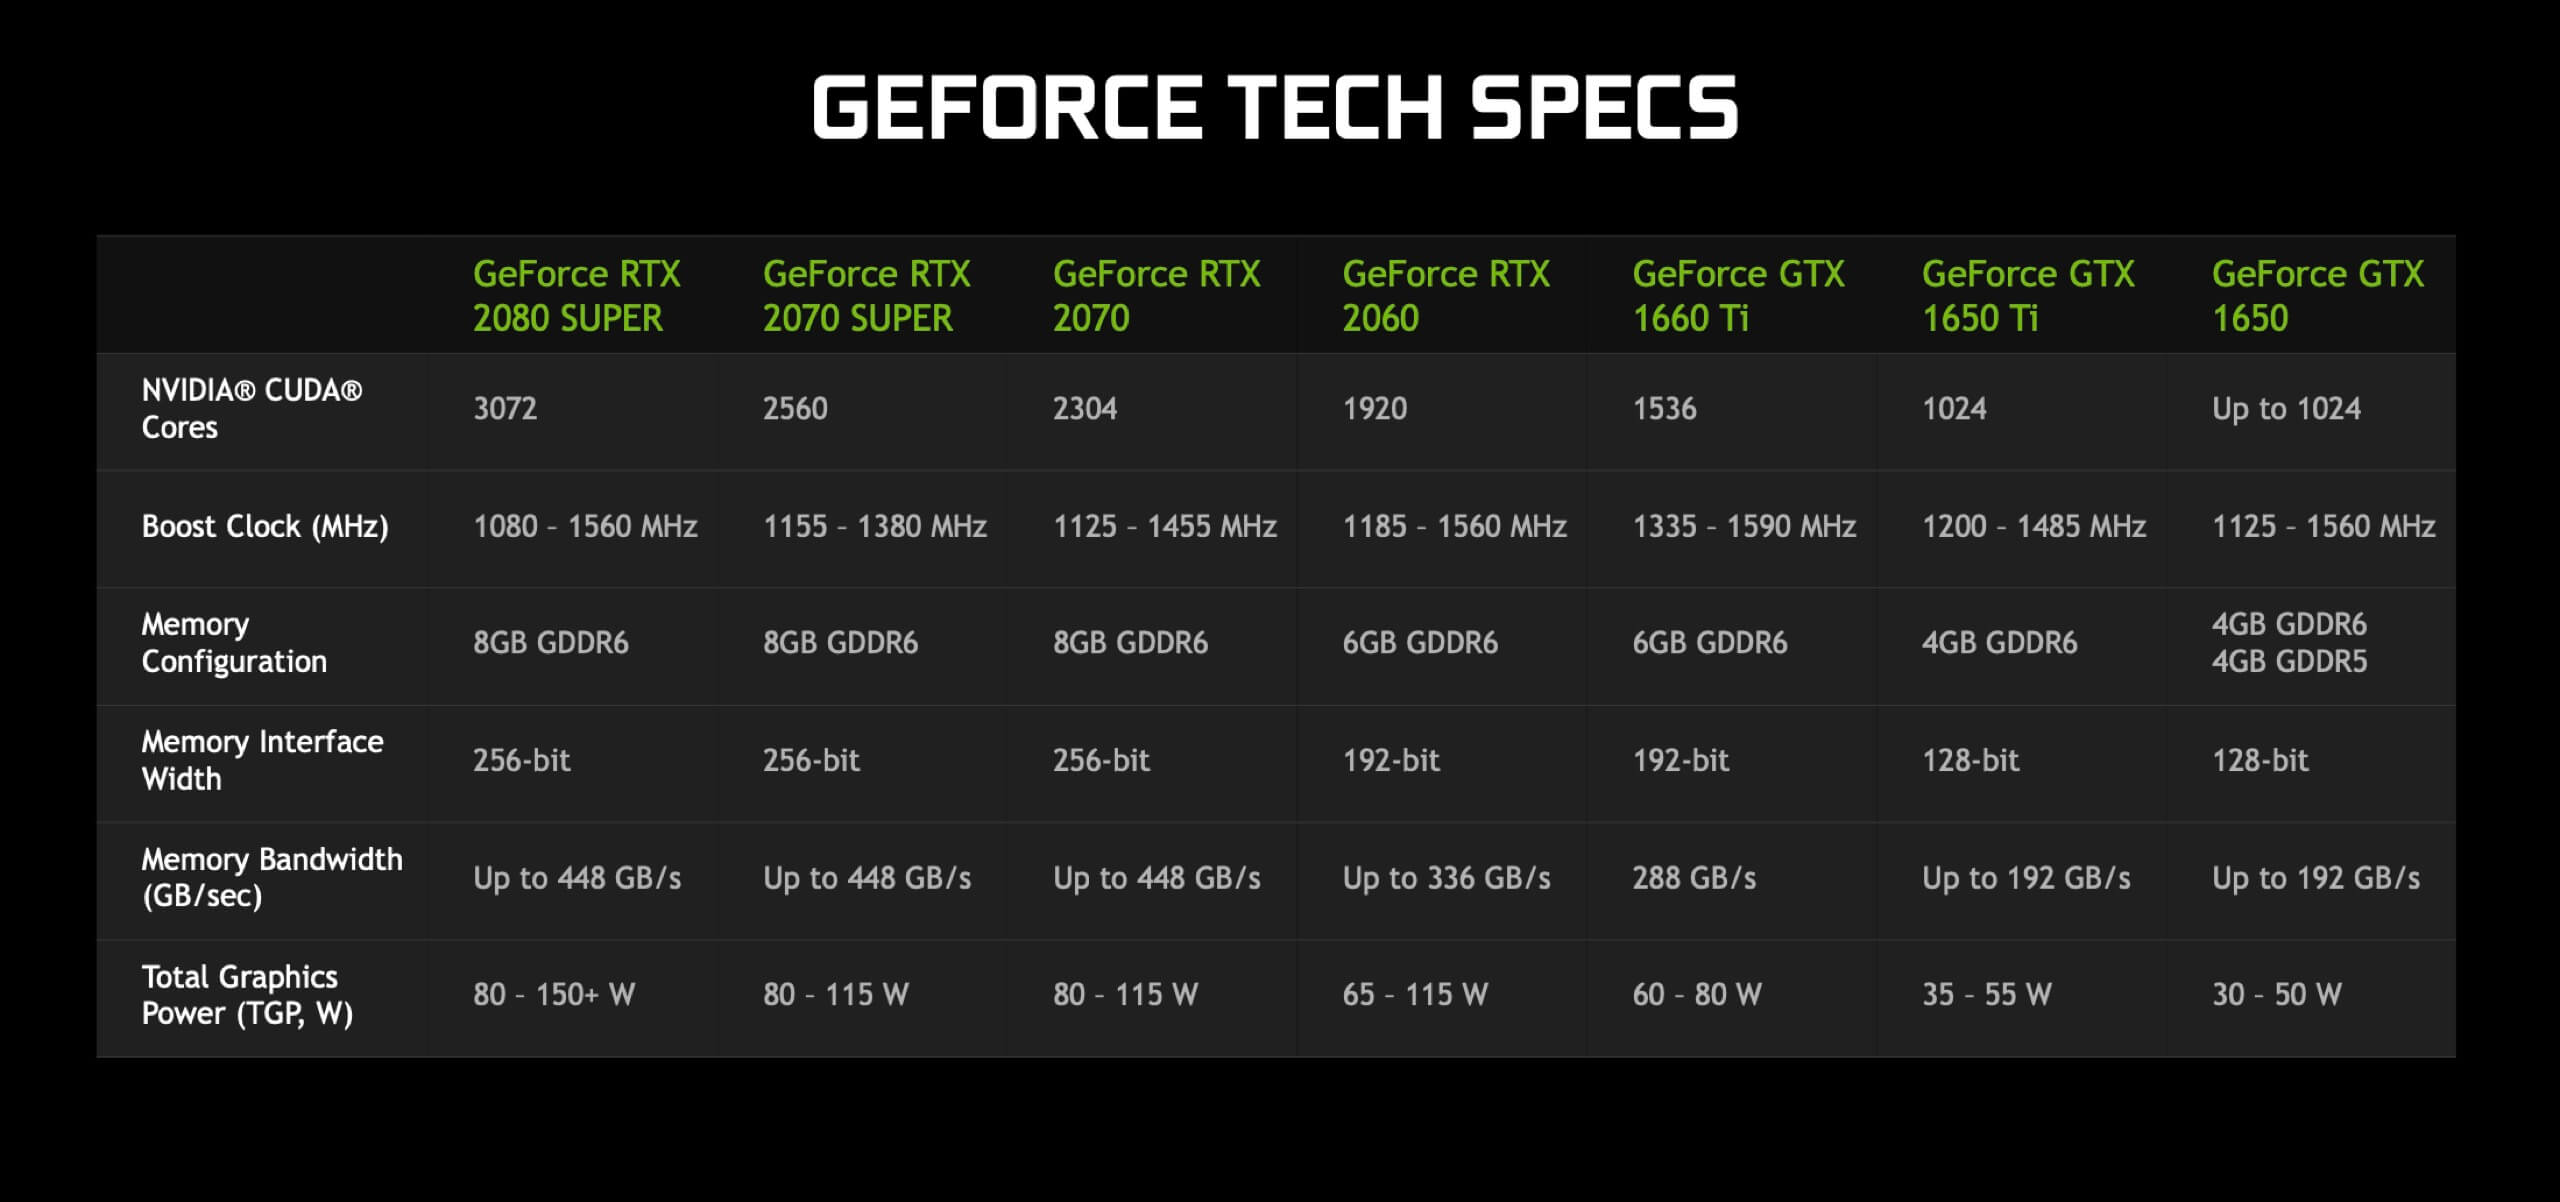
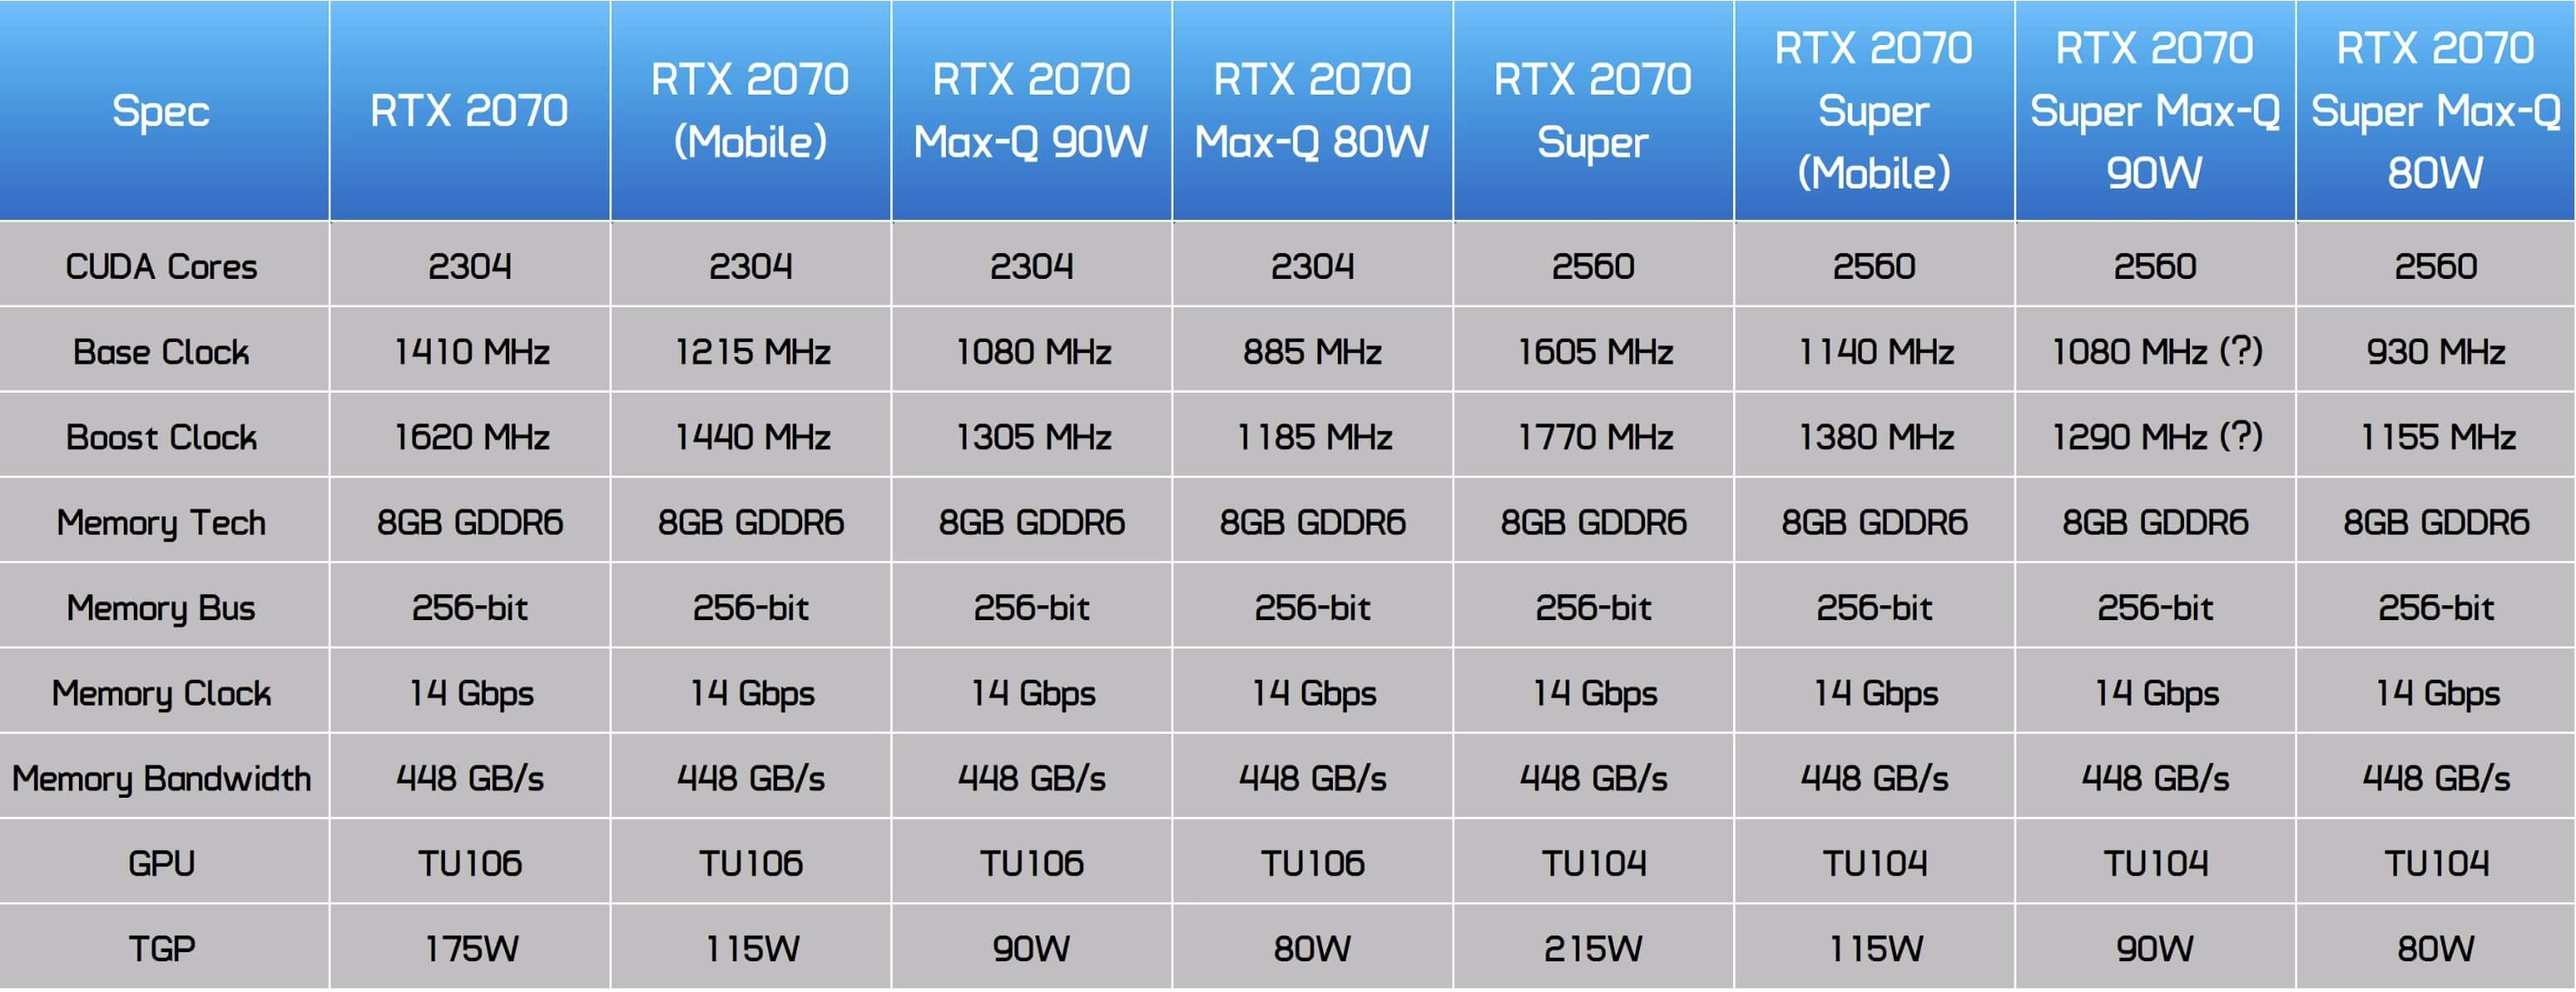
Nvidia’s desktop and mobile GPUs have the same CUDA core counts. So the RTX 2070 Super for laptops features the same TU104 GPU with 2560 CUDA cores as its desktop counterpart, however clock speeds are different. When looking at the Max-P variant at 115W, the mobile model has a 29% lower base clock and 22% lower rated boost clock, so naturally it’ll perform below an RTX 2070 Super desktop GPU. That’s not hugely surprising considering the desktop card is rated for 215W and has more room to dissipate all that heat. Comparing laptop to desktop, we also get the same memory subsystem that includes 8 GB of GDDR6 at 14 Gbps.
Max-Q models are configured at a lower clock to comply with heat dissipation constraints. The 80W model comes in at 930 MHz base and 1155 MHz boost. Our test laptop also supports a 90W configuration which can boost performance. Our understanding is that laptops that default to 90W will feature 150 MHz higher base clocks. Same as with all modern Nvidia GPUs, while the rated boost clock is listed at 1155 MHz, due to GPU Boost algorithms the actual in-game clock speeds tend to be much higher, so these specifications are really only a guideline.
The laptop we’ve used for testing is the Gigabyte Aorus 15G. This is the same unit from our Core i7-10875H CPU analysis, and it’ll allow us to test the RTX 2070 Super Max-Q performance in both the 80W and 90W configurations. Do note that because in this generation we’re getting both a CPU and GPU upgrade at the same time — all RTX Super laptops will feature new 10th-gen CPUs — ideally we’d love to be checking these GPUs out when paired with the Core i7-10750H, which is much closer to the Core i7-9750H used with many gaming laptops previously, and that would remove the CPU as a variable as best as possible. But right now that’s just not possible, so we’re sticking to mostly heavy GPU limited benchmarks throughout this review.

The Aorus 15G also packs 16 GB of DDR4-2933 memory and a 1080p 240 Hz display. Unfortunately, two of the new features Nvidia were touting at the RTX Super laptop launch are not included in this unit: we aren’t getting Dynamic Boost or Advanced Optimus, so that’s something we’ll have to evaluate later.
As with all our laptop testing, we try and lock down variables as much as possible. This means keeping the CPU at Intel’s default settings unless otherwise specified, and same with the GPU. We don’t use any included OEM utilities to overclock these GPUs, so this review is designed to show stock performance with a given power configuration, although some OEMs like Gigabyte in this instance allow you to choose power targets. We think many OEMs will do the same, so we’re showing both 80W and 90W performance to give you the clearest idea of how this GPU will perform in a variety of configurations. You can find the full list of laptops used for putting together the benchmarks here.
Benchmarks
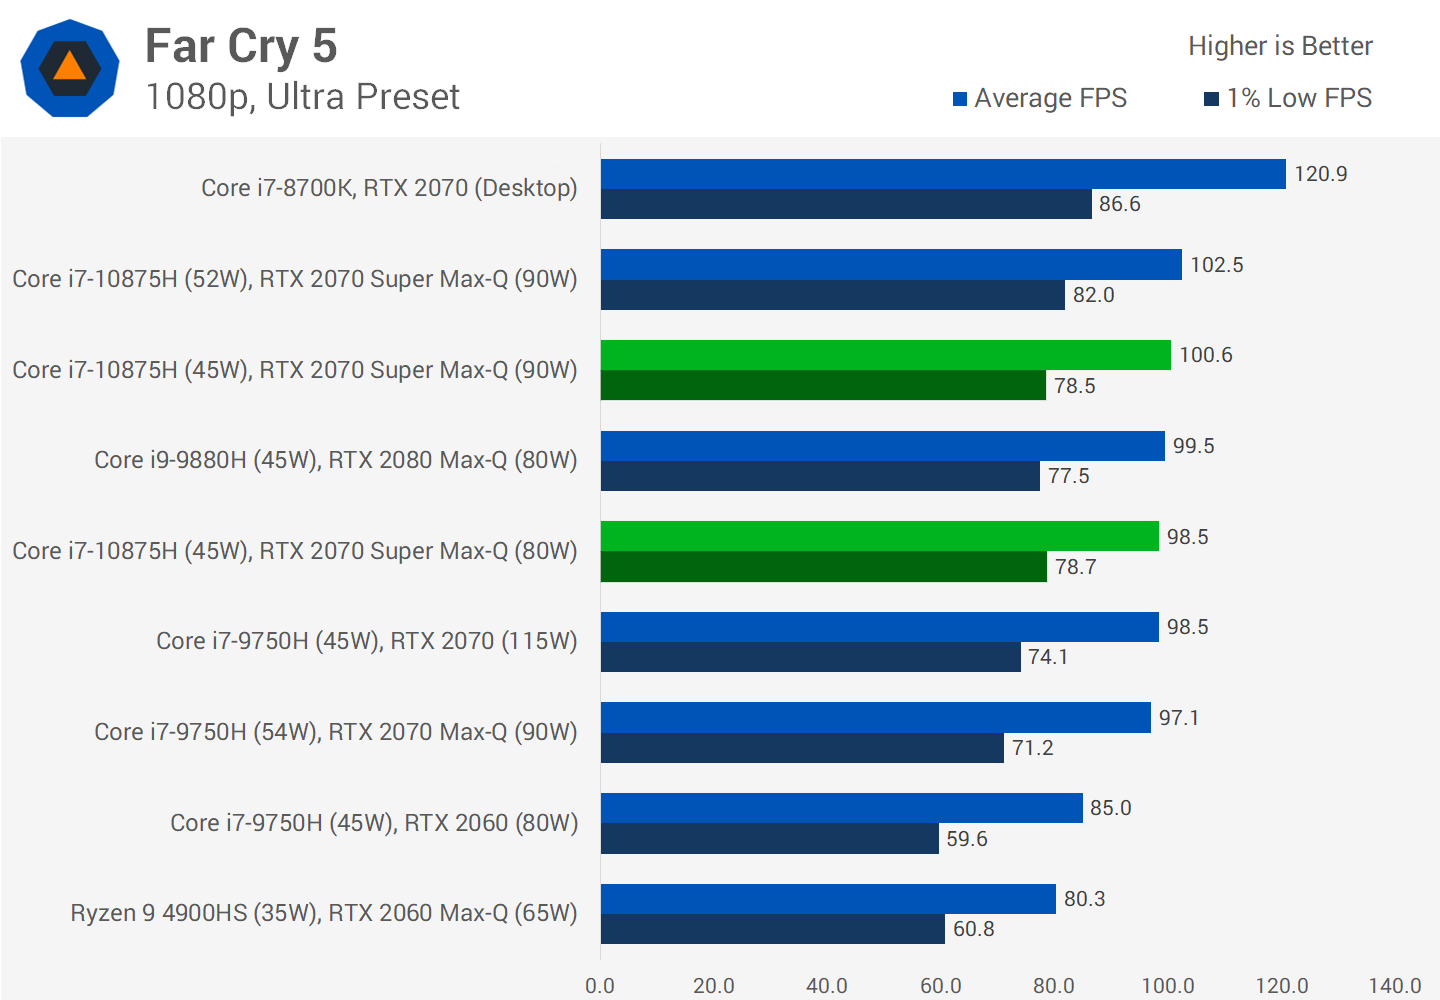
We’re kicking this one off with a fairly standard game in Far Cry 5. Here you can see quite a bunching of results with all of the RTX 2070 series GPUs we’ve tested, and you’ll probably spot the RTX 2080 Max-Q peeking out from the middle there, too.
Looking at average frame rates, the RTX 2070 Super Max-Q in its 80W configuration is just barely ahead of the RTX 2070 at 115W, which we guess in itself is impressive as it does beat the 90W RTX 2070 Max-Q which fell below the RTX 2070. But realistically when you look at all of these results, whether you get an RTX 2070 Max-Q through to RTX 2080 Max-Q doesn’t matter too much as the difference between the best and worst results is just 6% using Ultra settings.
What about in Battlefield V, again using Ultra settings at 1080p? The story here isn’t too different, although this time both configurations of the RTX 2070 Super Max-Q aren’t as fast as the 115W RTX 2070, falling 3 to 6 percent behind. The 80W configuration is also slower than the RTX 2080 Max-Q, but the margins here are similar to the RTX 2070, at just single digits.


Let’s now look at Shadow of the Tomb Raider, which is a more GPU intensive game than the previous two and allows the power of the RTX 2070 Super GPU to be unleashed. This is one of the strongest results for RTX 2070 Super Max-Q versus RTX 2070 Max-Q, both at 90W which is the comparison we have available. With this configuration, the new Super GPU is 13 percent faster and impressively, even the 80W variant is faster. This allows the 2070 Super Max-Q to come in 4% faster than the 115W RTX 2070 despite consuming just 80W of power. Impressive result in a mobile form factor.
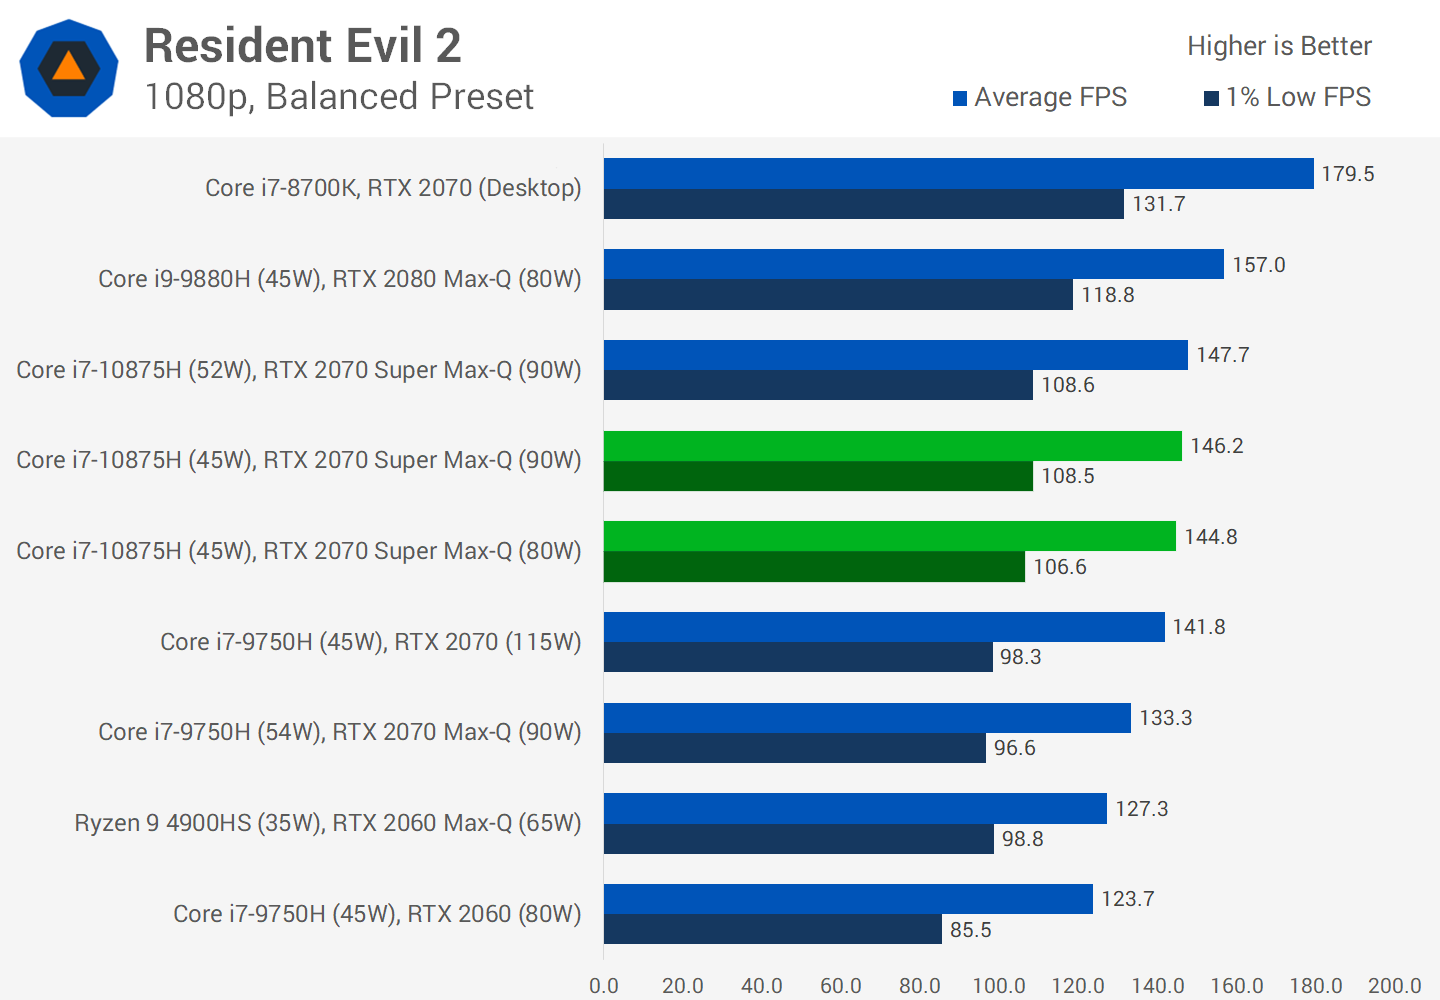
Resident Evil 2 using Balanced settings also played nicely on the RTX 2070 Super Max-Q at well over 100 FPS. Here we see an 11% performance gain over the RTX 2070 Max-Q, and a 2% lead over the RTX 2070. However, frame rates don’t quite keep up to the RTX 2080 Max-Q in this game, the larger GPU is better here at the same 80W power limit.

Metro Exodus is a very GPU intensive title and again we see quite a large bunching of results for all the RTX 2070 class GPUs. The 80W numbers for the 2070 Super Max-Q aren’t overly impressive, 2% slower than the RTX 2070, however this does flip over to a performance lead at 90W. In fact this game saw one of the largest gains for increasing the power limit at 6%, which allows it to be just under 5% faster than the RTX 2070 when all said and done. However when comparing 90W numbers to the 90W RTX 2070 Max-Q, we’re not seeing much of a gain, just a 1% improvement to average frame rates.
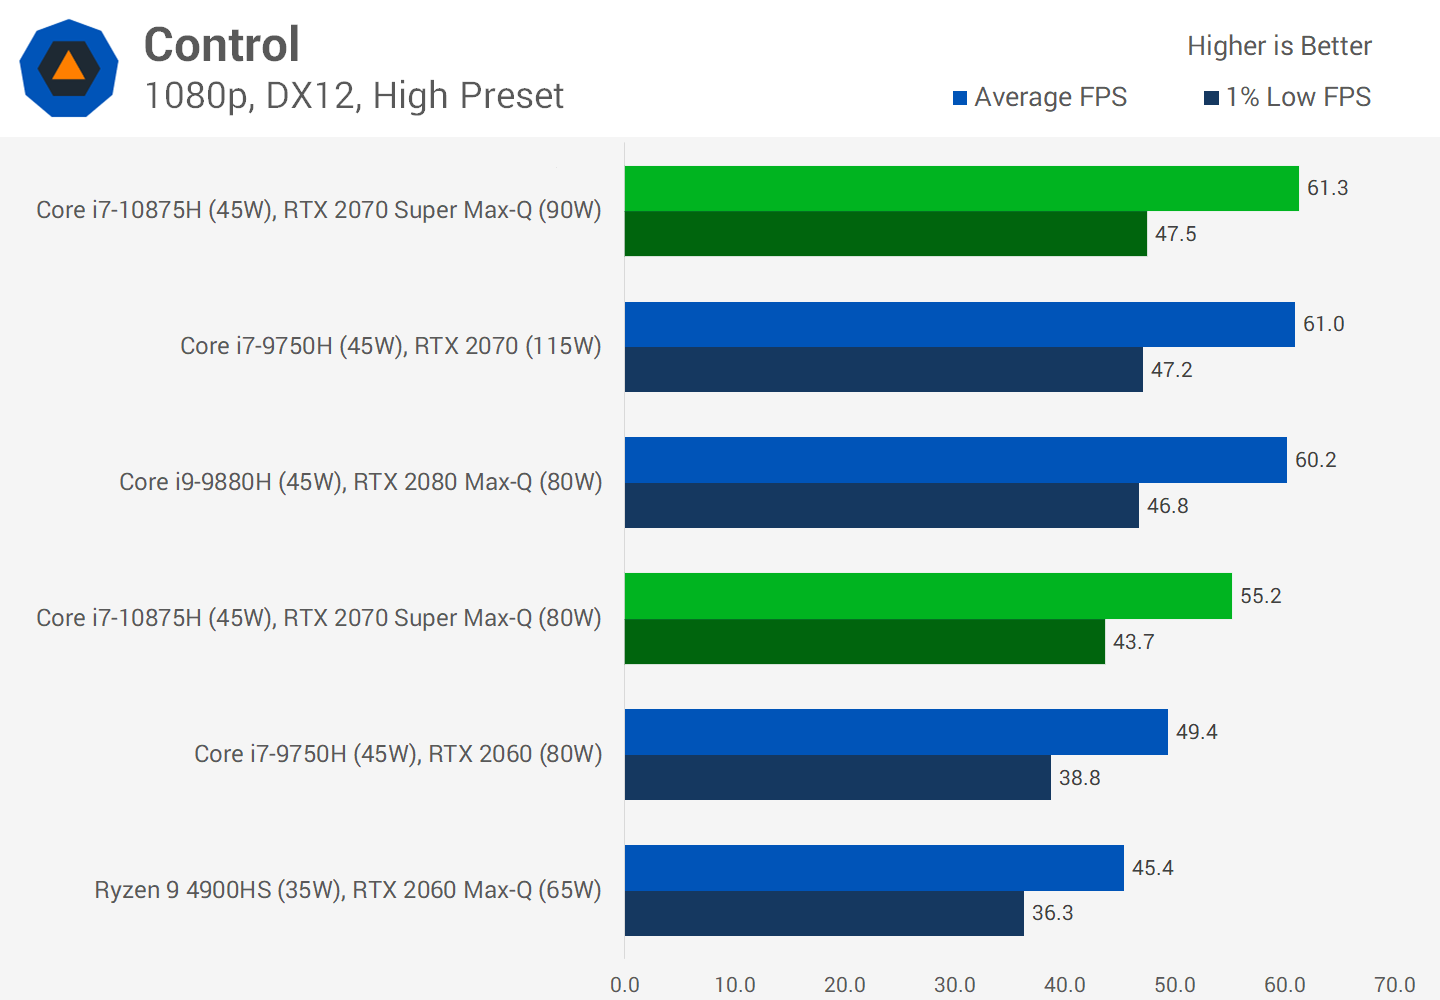
Control is a very GPU demanding title at 1080p using High settings, and here we’re testing without RTX features, if you choose to enable DLSS you will see better performance. The 80W configuration of the 2070 Super Max-Q ends up nearly 10% behind the RTX 2070, but benefits from an 11% performance increase when upped to 90W, allowing to edge slightly ahead of the more power hungry last-gen configuration. This isn’t a bad result from a lower power draw part.
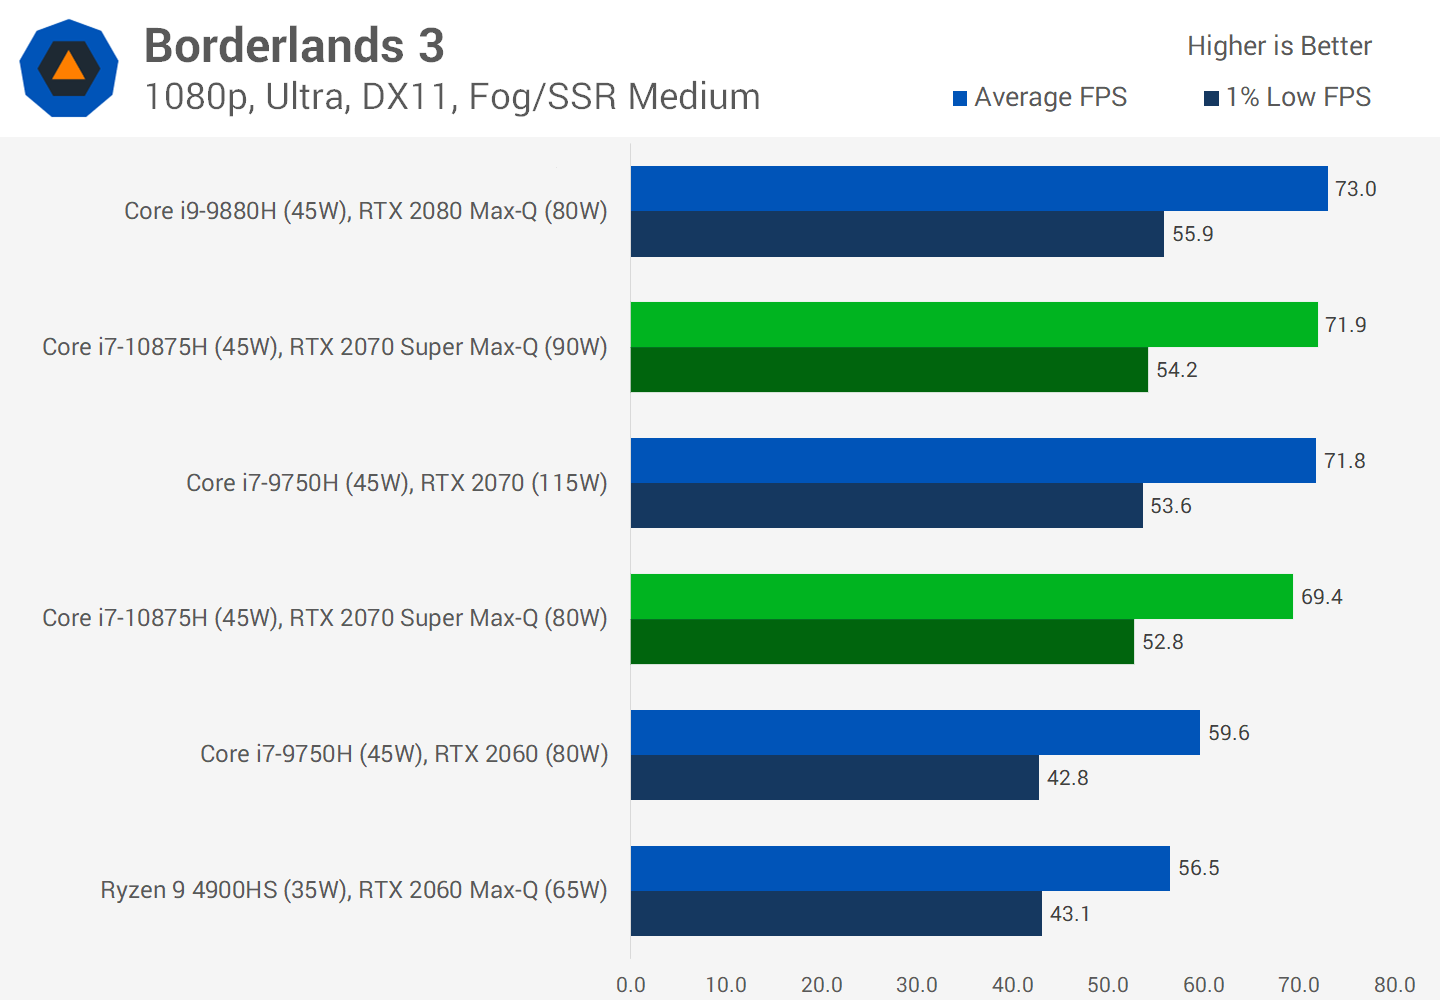
Borderlands 3 is another title where it’s only at 90W can the RTX 2070 Super Max-Q match the performance of the RTX 2070, while falling about 5% behind when we compare 80W 2070 Super Max-Q to 80W 2080 Max-Q. These names are pretty confusing but that’s where we are at with modern gaming laptop GPUs.
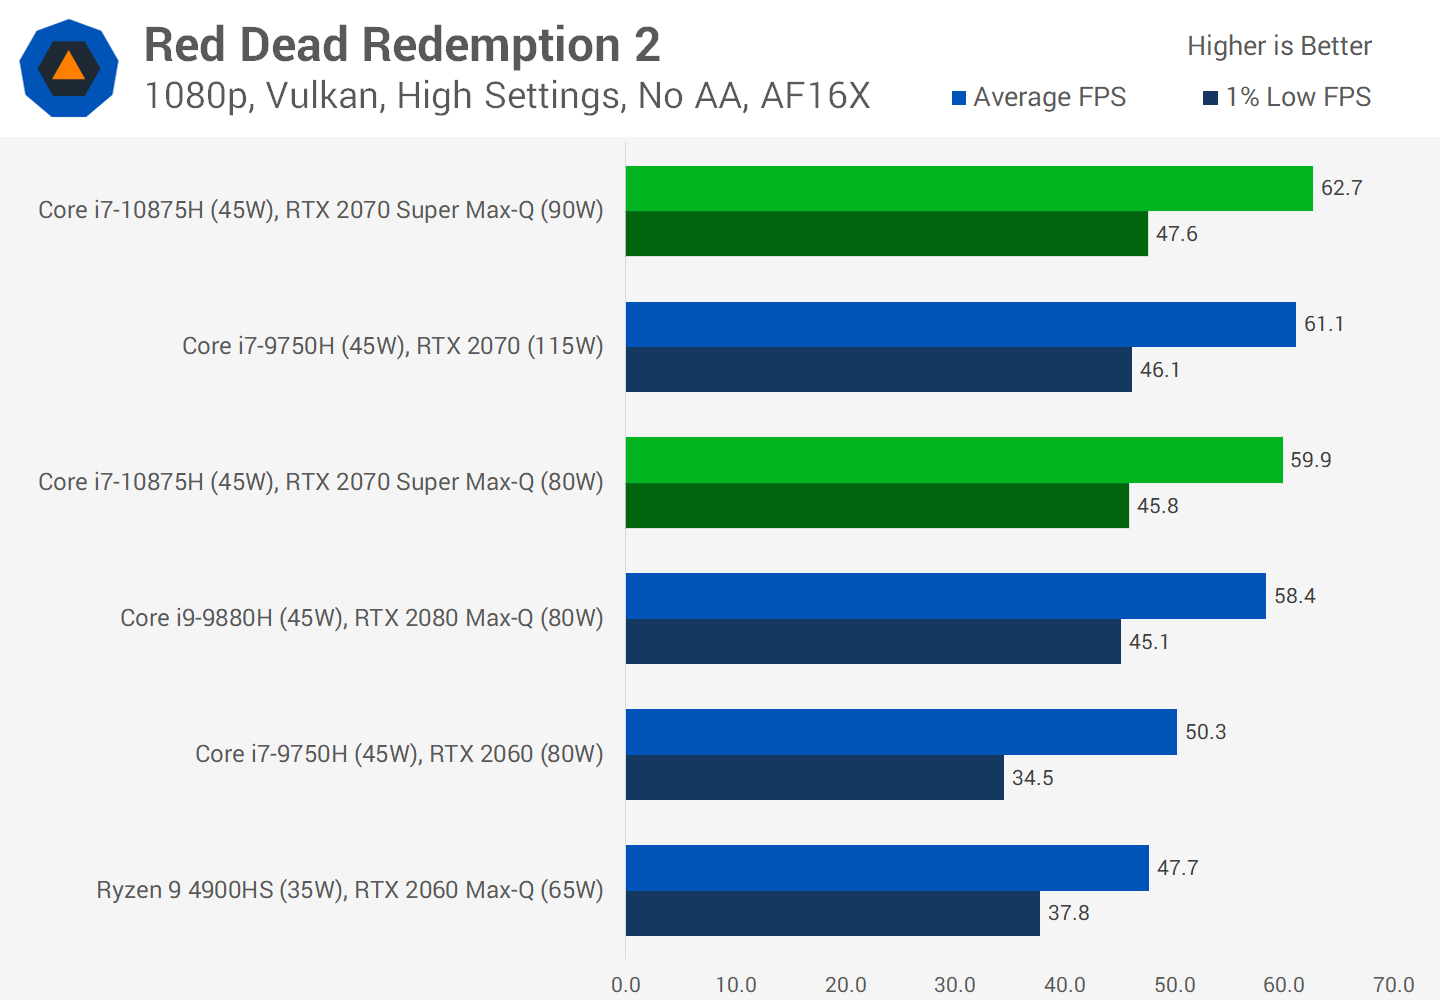
Red Dead Redemption 2 is naturally a very popular title on PC and the performance story is very similar to some of the games we’ve just been looking at. The 80W configuration of the 2070 Super Max-Q is slower on average than an RTX 2070, but faster at 90W. And surprisingly this is one of the few games we tested where the 80W 2070 Super Max-Q is actually faster than the 2080 Max-Q running at the same power limit.
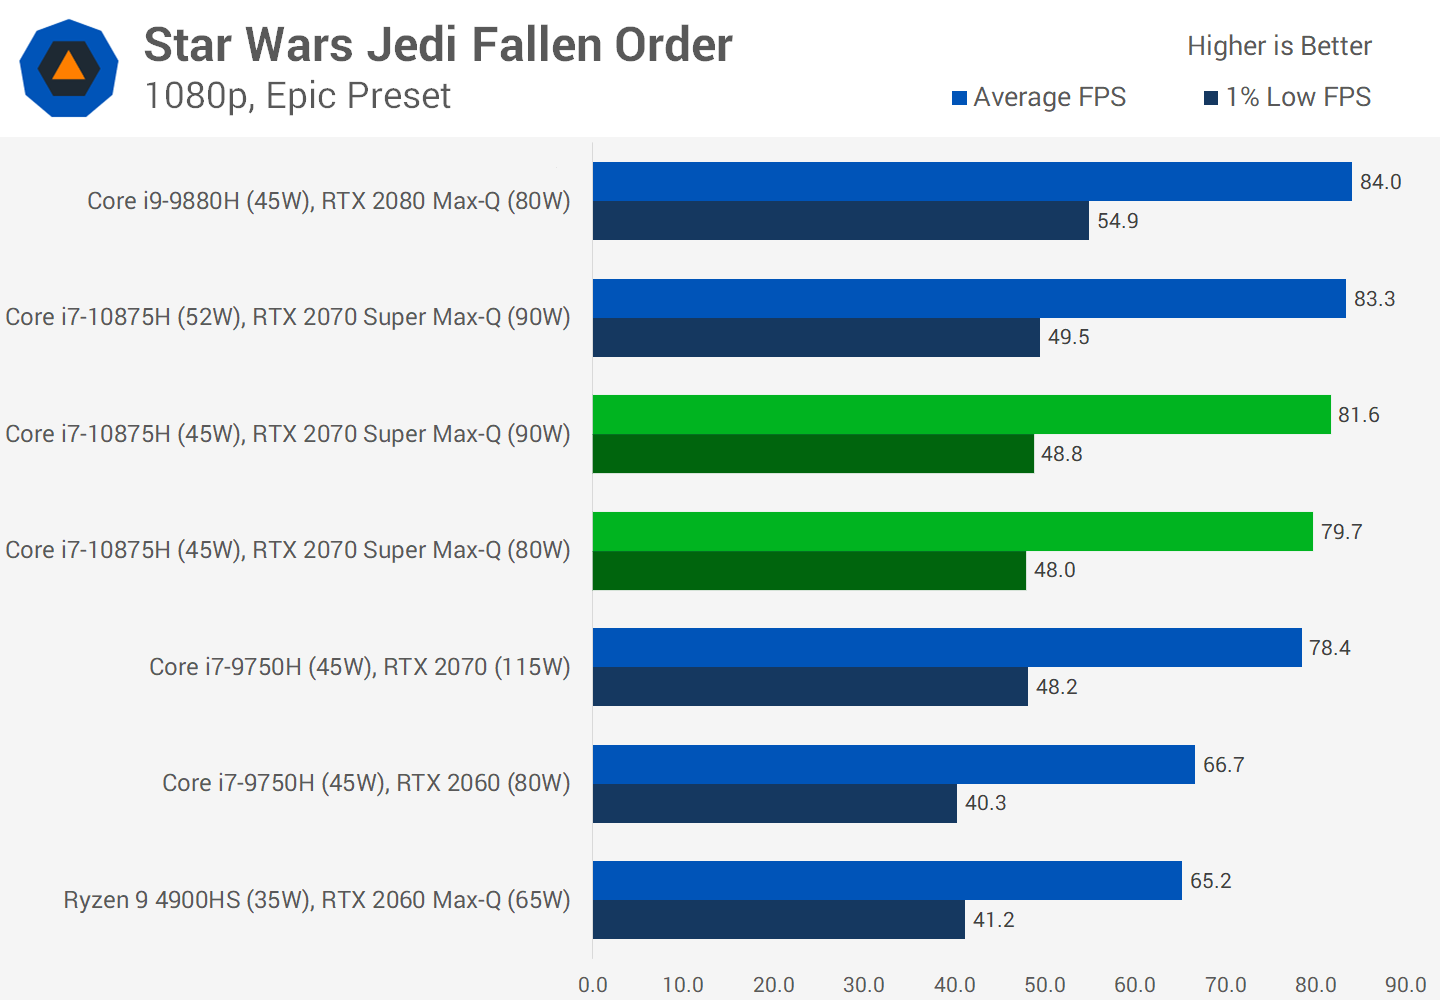
Star Wars Jedi Fallen Order plays nicely with the RTX 2070 Super Max-Q, with both power variants clocking in 2 to 4% faster than the standard RTX 2070 for laptops. It’s not quite as fast as the RTX 2080 Super Max-Q but we think performance is good in this game either way, even using the Epic preset.

Grand Theft Auto V is the last title we’ll take an in-depth look at, representing an older but still popular game. There’s not much here that we haven’t already talked about, performance margins are slim between all the GPUs we’ve been discussing and that’s no different here really. The 80W 2070 Super Max-Q is 2% behind the RTX 2070, but 2% ahead at 90W. This is one of the rare titles where the new Super GPU is slower than the non-Super model, but we believe some of that is down to a CPU limitation, the game does benefit from faster CPUs at these sorts of frame rates.
Performance Breakdown: Super or Not?
It’s time to work through some performance breakdowns. We’ll start with the RTX 2070 Super Max-Q versus the RTX 2070 Max-Q, both at 90W, in GPU limited games. On average the new Super GPU was 7% faster under the same power limit, but this varied between titles. Some games weren’t faster by much, others were up to 15% faster. This will depend on how the game uses resources and whether the game prefers core frequency or core count.

Interestingly, though, the 80W variant of the RTX 2070 Super Max-Q is still faster than the 90W RTX 2070 Max-Q we tested, not in all games and not by much, but a 3% improvement on average is respectable and points to a small gain in efficiency from the larger CUDA core array with its slightly reduced clocks.

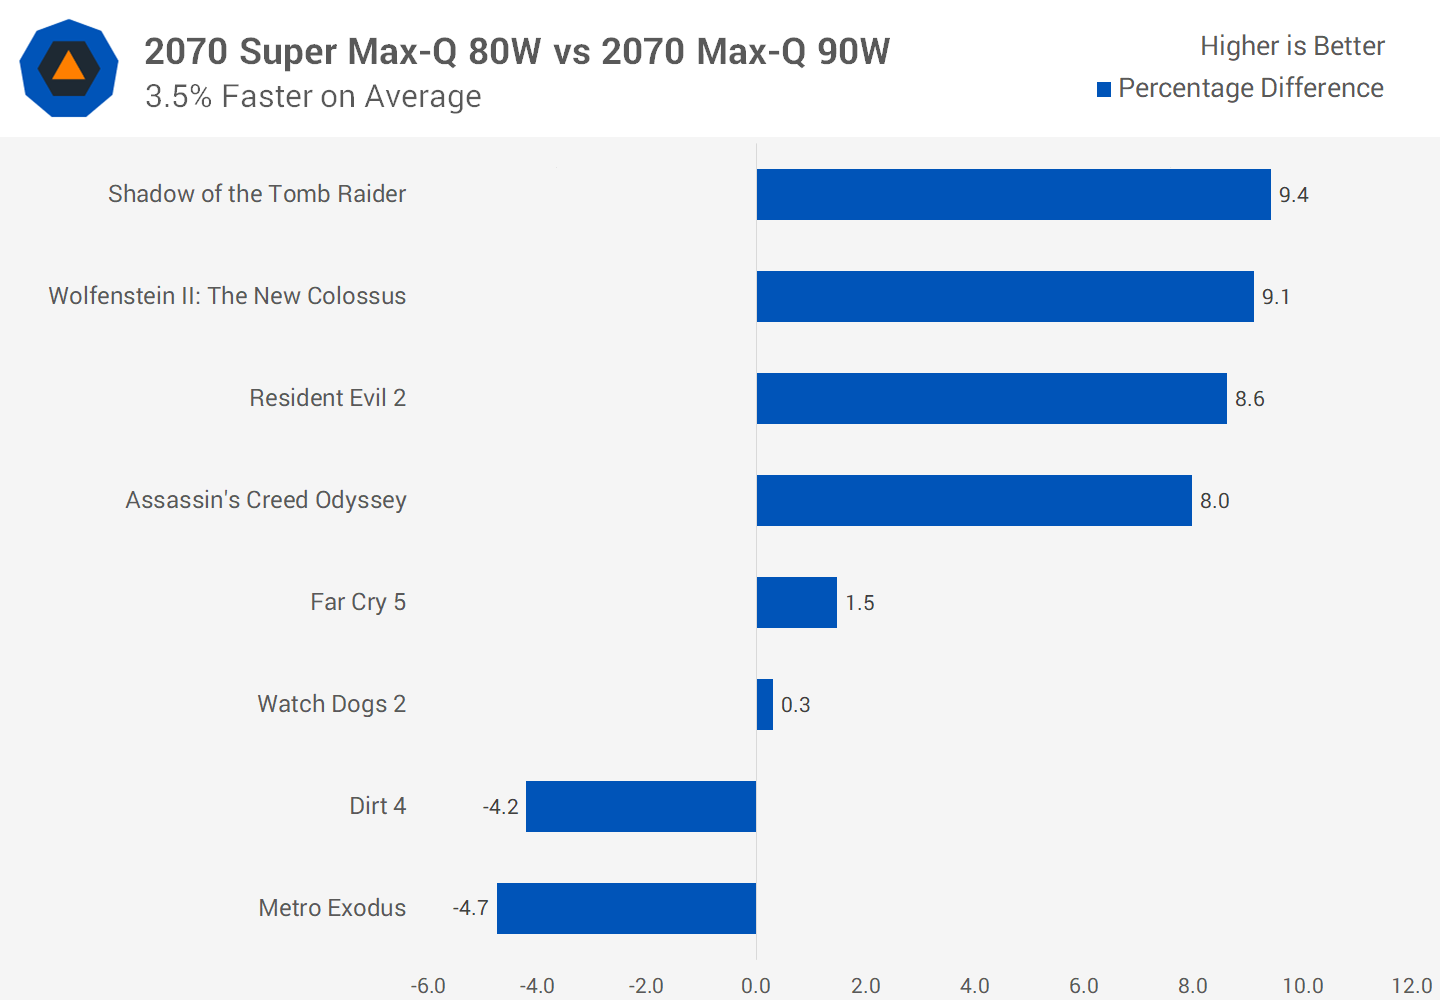
Speaking of 80W versus 90W, here is how the higher power variant stacks up. In some titles we saw as much as an 11% performance gain, but in others gains were more modest. On average we ended up with just a 3-4% performance improvement from the higher power limit, which is a little bit lower than the gains seen from higher power limits in previous generations. The 90W RTX 2080 Max-Q for example, is 7% faster than the 80W configuration on average, when we reviewed it back in early 2019.

The jump up to this new Super model has allowed the RTX 2070 class Max-Q variant to pull much closer to the regular RTX 2070 running at 115W. Running at 80W, the RTX 2070 Super Max-Q is just 2% slower on average, with some games showing it to be faster, and others slower. In our previous testing, the 80W RTX 2070 Max-Q was around 10% slower, sometimes more. We are still talking about RTX 2070 Super versus RTX 2070 here so Nvidia has needed to step up a GPU tier to achieve this performance parity at a lower power target.
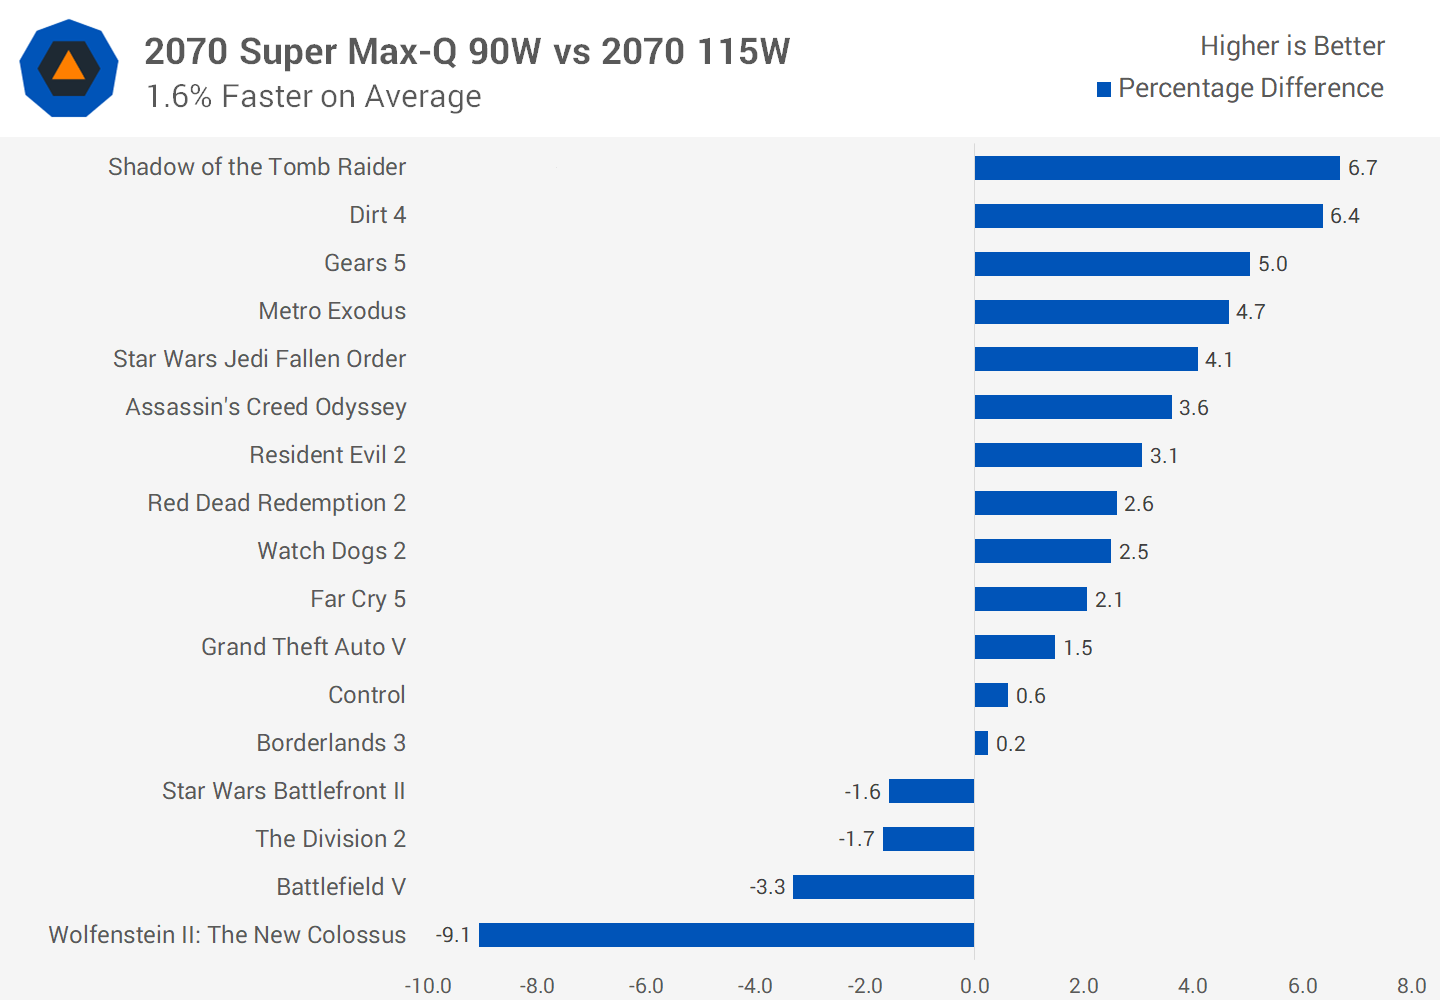
At 90W, the RTX 2070 Super Max-Q is able to pull ahead of the RTX 2070 on average, but only just. The low power Max-Q model isn’t always the faster GPU, but in a lot of the most GPU demanding titles it tends to perform quite well here, so I’d be hoping most people buying a laptop with this GPU inside end up getting the 90W configuration.

The RTX 2070 Super Max-Q still has its place in the line-up though. It fell only 3% behind the RTX 2080 Max-Q on average, so while we can’t quite replace last generation’s higher-tier product with a lower tier design, it’s very close.

The RTX 2070 Super Max-Q does provide considerably more performance than the RTX 2060 when both are configured to 80W. The new Super GPU is 18 percent faster, which suggests it is by far the more efficient design.
After all the comparisons above, it’s clear that Nvidia has crowded the market and the gains you get from moving up one GPU bracket are very small most of the time. From the RTX 2060 to RTX 2070 Max-Q you’re looking at about a 10% gain, but anything you get above that are marginal increments.
What We Learned
Let’s try to keep things as simple as possible. Nvidia says that the RTX 2070 Super is replacing the RTX 2070 at roughly the same price point. So for the same money, you’re getting a ~7% performance improvement. It’s not groundbreaking, but we’ll take it.
The RTX 2070 will continue to exist in the market by replacing the RTX 2060 in that price tier, so it’ll be possible to choose between RTX 2070 Max-Q and RTX 2070 Super Max-Q models. Gigabyte’s Aero 15, for example, is available with either GPU plus an i7-10750H. The RTX 2070 Max-Q model is $1,900, and the RTX 2070 Super Max-Q is $2,100. That’s an 11% increase in price for 7% more performance, or up to 15% in a best case scenario.

If you are tossing up between Max-Q and non Max-Q laptops, the RTX 2070 Super Max-Q is providing similar performance to the 115W RTX 2070, which is neat from an efficiency sense, but not as nice when exploring value. Laptops that use the full 2070 tend to be more affordable. This revamped pricing structure doesn’t solve the value disparity between Max-Q and non Max-Q GPUs: Max-Q is always worse value, but that’s the premium you pay for slimmer, nicer, more portable machines.
Then there are some edge cases where companies will replace the full RTX 2070 with an RTX 2070 Super Max-Q. That’s what happened with the Gigabyte Aorus 15. In this scenario, the GPUs will perform relatively the same, but the CPU has received an upgrade from 6 to 8 cores. Unless you need improved productivity performance, this sort of “upgrade” isn’t very enticing for gamers. If a laptop’s cooler is capable of handling a 115W GPU, the more sensible option would have been upgrading to a 2070 Super Max-P, or keeping the RTX 2070 but reducing the price.

We should also note that the Aorus 15 we tested has neither Dynamic Boost or Advanced Optimus, two new features Nvidia are pushing this generation. These have the potential to improve performance further, so what we’ve talked about today is more of a baseline metric. We’ll have to explore those features in a future review as we receive more laptops for testing.

Bottom line, in terms of pure performance the needle hasn’t shifted too much, but hopefully we’ll see new opportunities for better value laptops in the months to come. The excitement with 2020 laptops will come from the use of Ryzen 4000 APUs, Nvidia’s Advanced Optimus, new 300 Hz displays, and also these nice mechanical key switches used in the Aorus.
Shopping Shortcuts
[ad_2]
Source link
